Resources for air quality data
Air quality in Virginia
|
The Virginia Department of Environmental Quality (DEQ) website hosts an interactive map with live AQI ratings for their 36 monitoring stations across the state. Apart from the overall AQI, it also includes levels of five of six criteria air pollutants (carbon monoxide, nitrogen dioxide, ozone, particulate matter (PM2.5 and PM10), and sulfur dioxide).
|
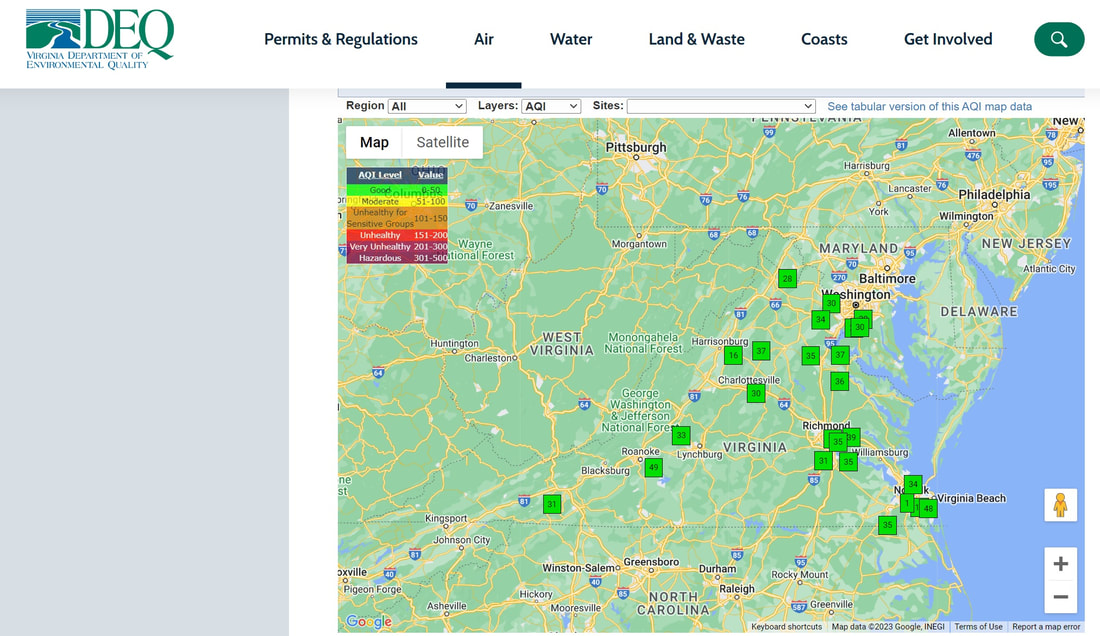
Screenshot of the interactive map from the Virginia Department of Environmental Quality (dated 02/22/2023)
|
Air Quality in the U.S.A
|
The National Oceanic and Atmospheric Administration's National Air Quality Forecast System Ozone graphics are presented as web-based gridded representations of the 1-hr and 8-hr averages of ozone concentrations modeled twice a day. The forecasts span out to a minimum of 30 hours to a maximum of 48 hours from current time.
|
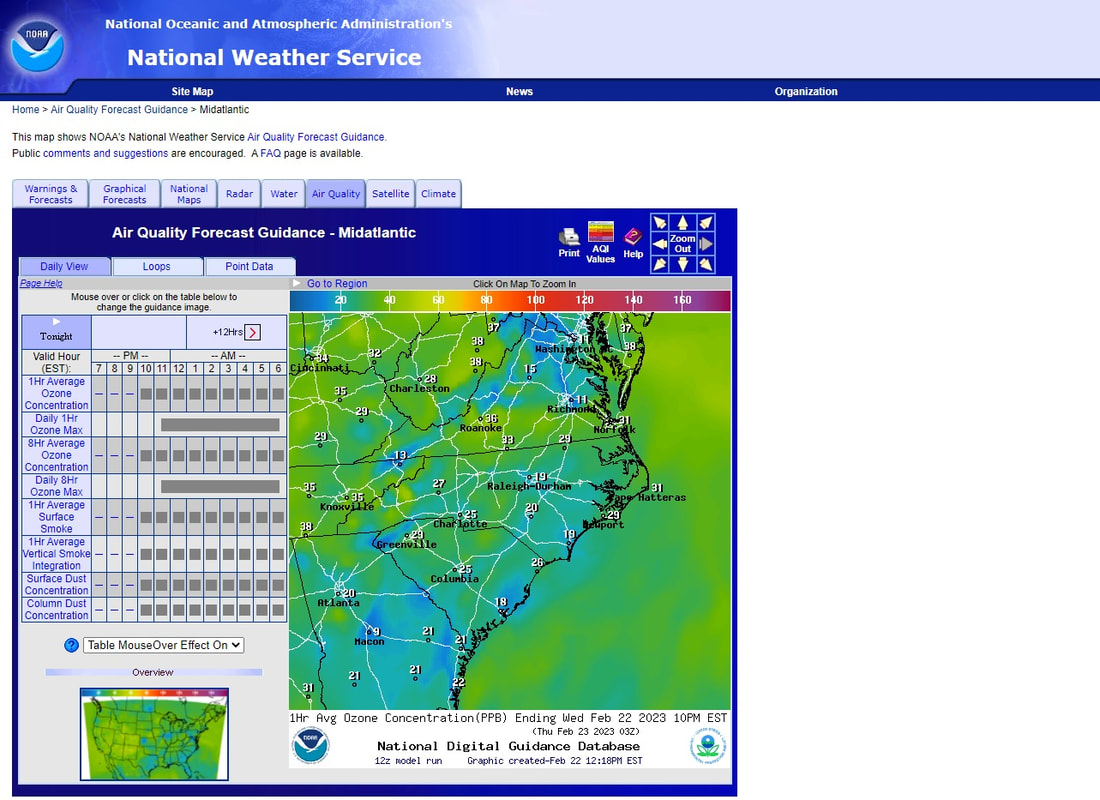
Screenshot of the interactive map from the National Oceanic and Atmospheric Administration (dated 02/22/2023)
|
Global Air Quality
|
The EPA AirData website provides access to air quality monitoring data collected by the United States Environmental Protection Agency (EPA) and other government agencies. AirData allows users to search for monitoring sites by location or pollutant, view current and historical air quality data, and generate reports and maps. This information can be used by researchers, policymakers, and the general public to better understand air quality trends and make informed decisions to protect public health and the environment.
|
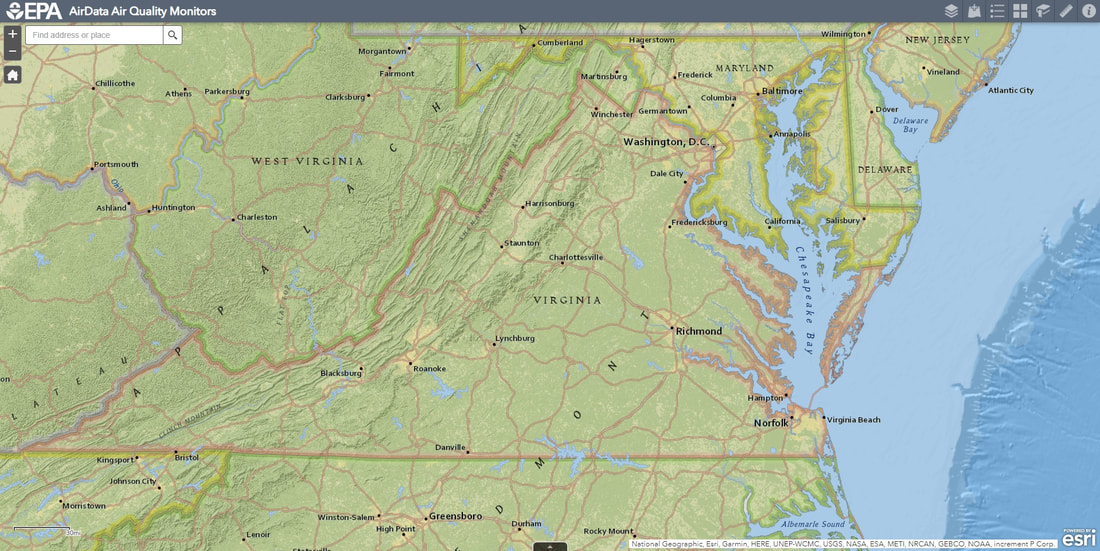
Screenshot of the interactive map from the Environmental Protection Agency (dated 02/22/2023)
|
Purple air: Particulate matter sensing by community scientists
|
PurpleAir is a crowdsourced air quality monitoring network that uses low-cost sensors to collect data on particulate matter levels in communities worldwide. The system provides high-resolution data in real-time that can identify air pollution hotspots and track changes in air quality over time. The data is aggregated and displayed on a map that is accessible to the public, making it a valuable tool for individuals and communities to monitor air quality and take action to protect their health. PurpleAir is an example of how technology and citizen engagement can be used to address environmental challenges and promote public health.
|
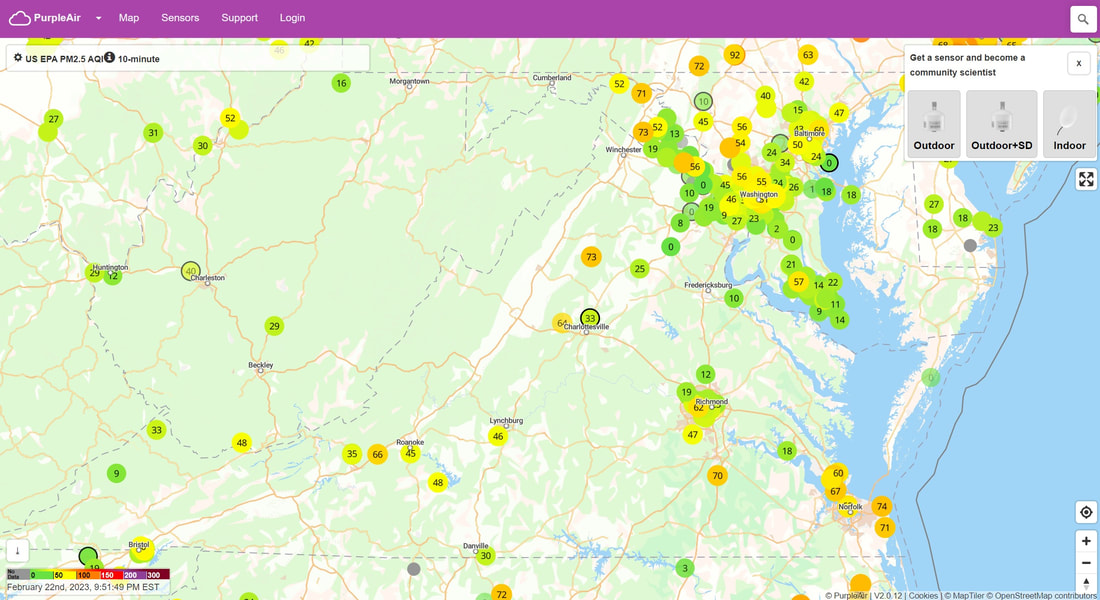
Screenshot of the Purple Air map (dated 02/22/2023)
|
Cancer-causing industrial air pollution in the U.S.
|
ProPublica is a nonprofit newsroom that has created an interactive map that visualizes the impact of cancer-causing industrial air pollution in the United States. The map allows users to explore data on toxic emissions from industrial facilities across the country, and to see how these emissions are affecting nearby communities.
|
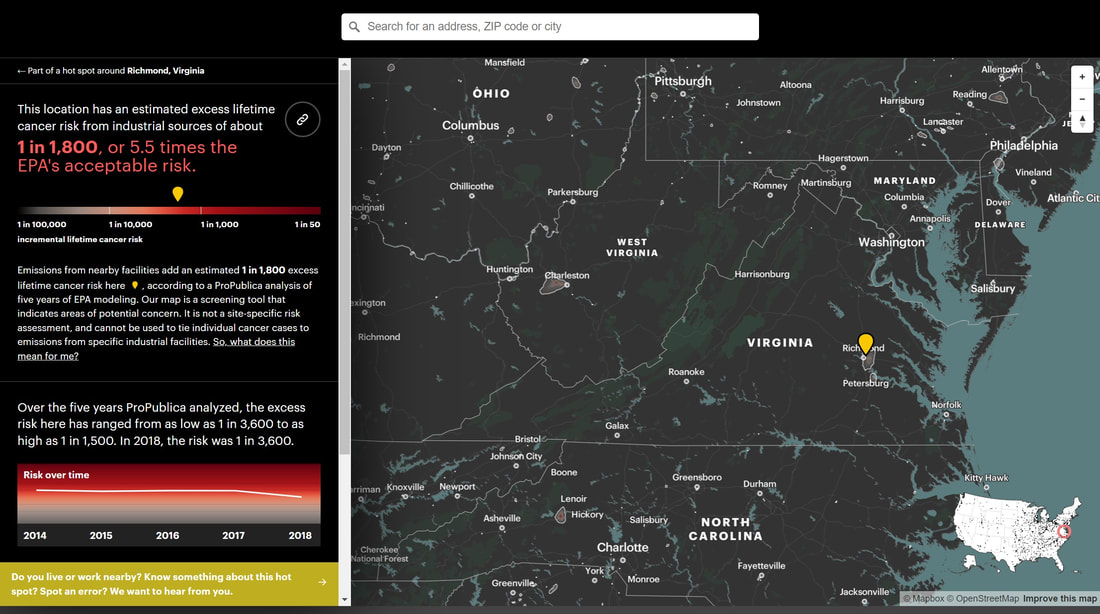
Screenshot of the interactive map by ProPublica highlighting the areas with cancer-causing industrial air pollution (dated 02/22/2023)
|
More interactive AQI maps
|
|

|
|
The AirNow Interactive Map is an online tool that provides real-time information on air quality conditions across the United States. The map displays color-coded air quality indexes for various pollutants, including ozone, particulate matter, and carbon monoxide, allowing users to quickly and easily see the current air quality in their area.
|
The IQAir Interactive Map is an online tool that provides real-time information on air quality conditions across the world. The map displays color-coded air quality indexes for various pollutants, including PM2.5, PM10, ozone, and nitrogen dioxide.
|
